Understand Confidence Intervals Through Simulations

GIF animations to help understand confidence intervals.
We often see “95% confidence intervals”. For example, in a linear regression senario, there are confidence intervals for the coefficients of the covariates.
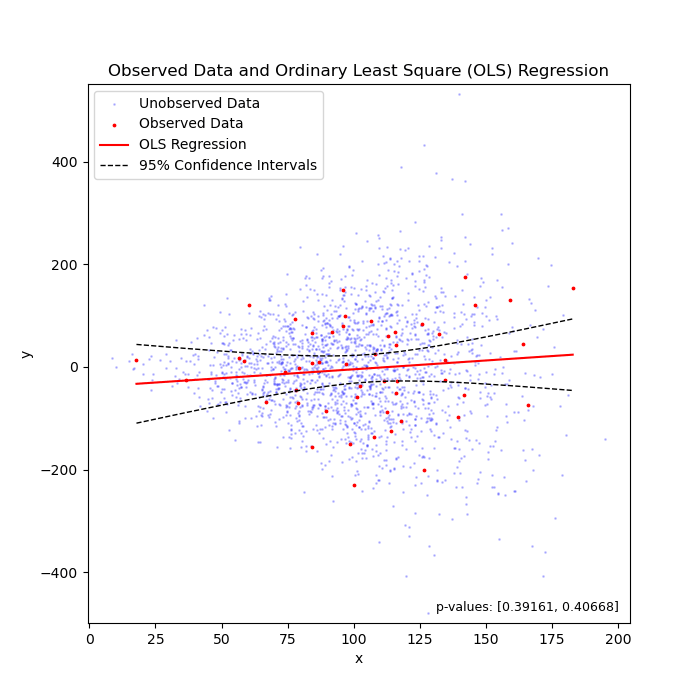
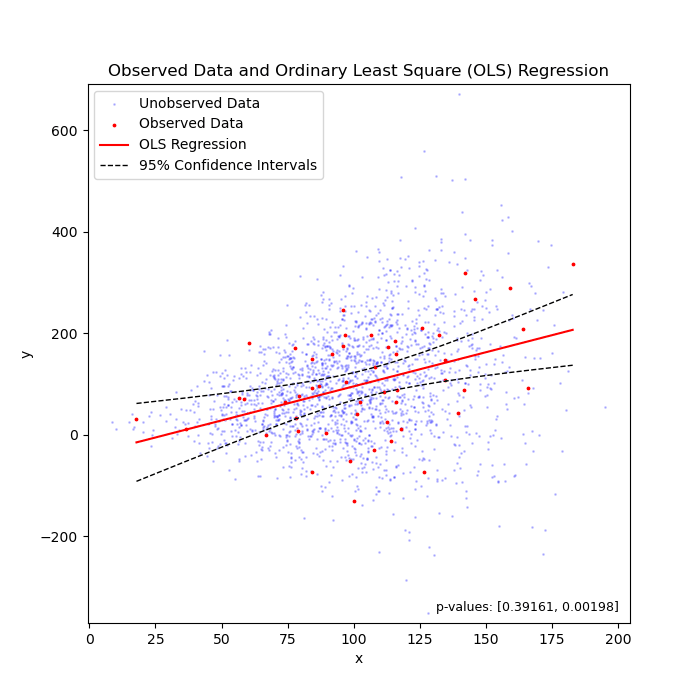
Linear regression under heteroscedasticity, when the truth is "flat" (left) or "sloped" (right).
But what the heck do they mean?
To my knowledge, we can say that 95% of chance, the unknown parameter that we are estimating should fall between the confidence intervals. In the above two cases, the unknown parameter is the coefficient (i.e., the slope of the regression line).
Let’s use some simulations to understand this better!
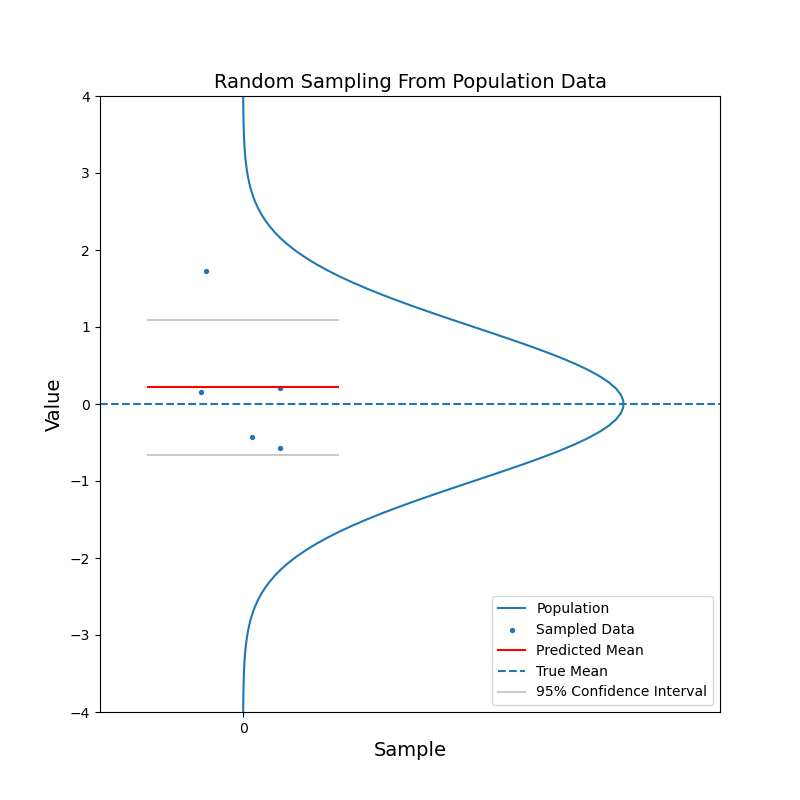
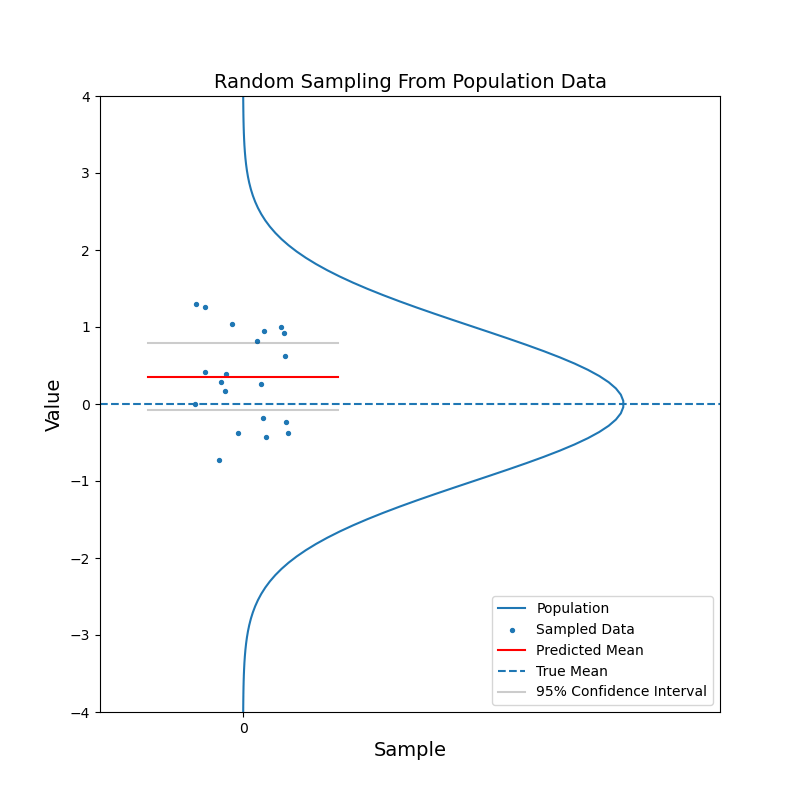
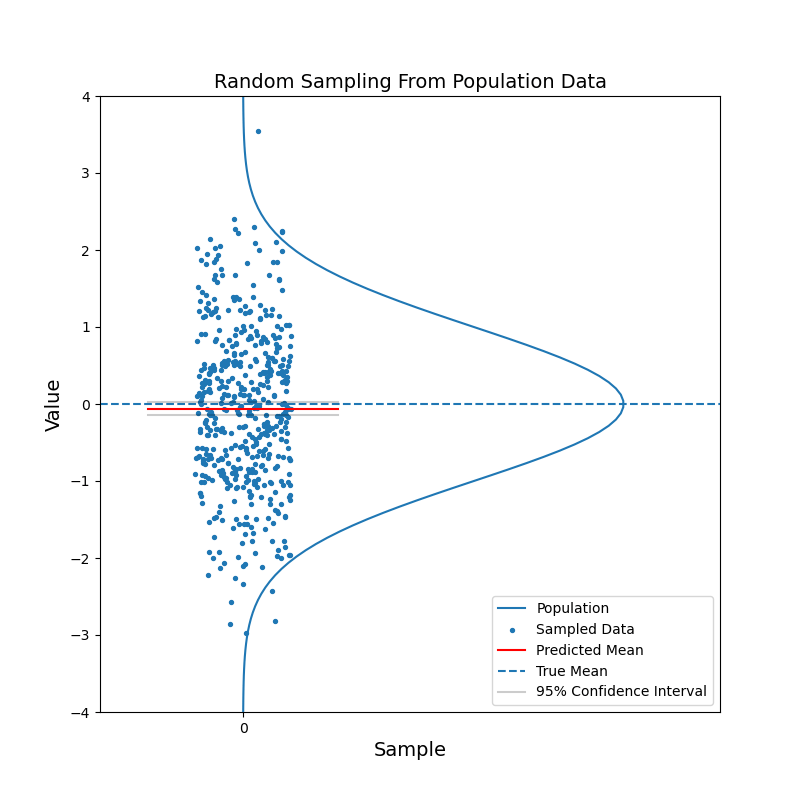
Say we have a large population, which consists of billions of people. We are curious about the mean of a certain characteristic of this population, say the left-right handness index (a negative value means left-handed, a positive value means right-handed). It is not feasible to test the index for the entire population and then calculate the mean. Instead, we take a random sample from the population and calculate the mean of the left-right handness index for this sample. We use this mean as our estimate for the mean of the population. To reflect the uncerntainty of this estimate, we calculate the 95% confidence interval. With the 95% confidence intervals, we can say: hey, there is 95% of chance that the mean of the population should fall in this range.
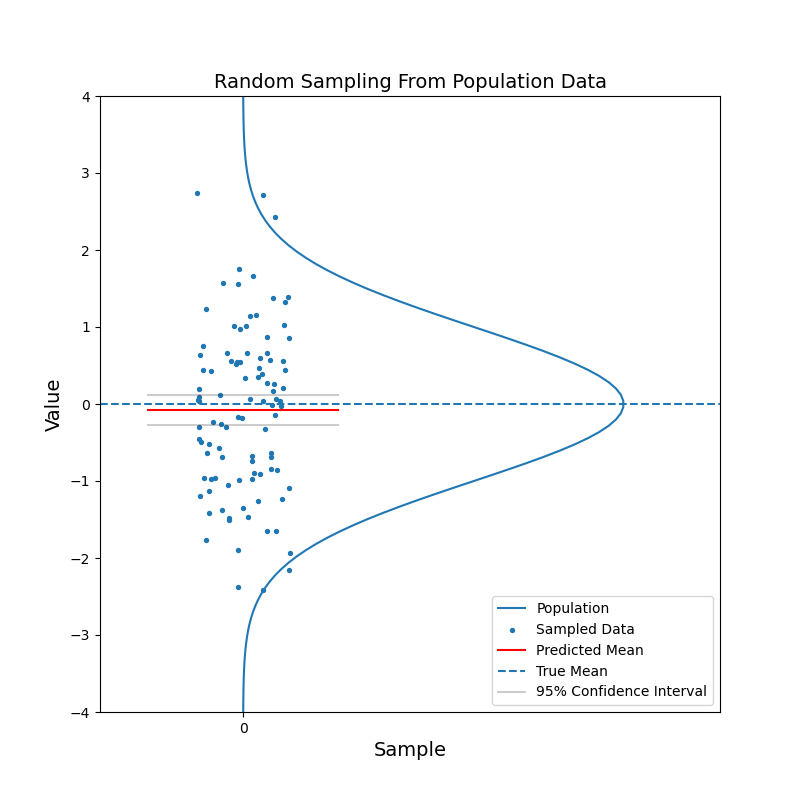
What just happened?
The red horizontal line, representing the estimated mean, jumps up and down. But in most cases, the true mean is contained within the confidence interval. With increasing sample size, the confidence interval becomes narrower. And the estimated mean gets closer to the true mean in general. In other words, the estimation becomes more confident.
Let’s take a step further!
Now consider when we have data coming from two different populations. Population 1 (blue) is in general right-handed, and population 2 (red) is in general left-handed. Like before, we take random samples from each population.
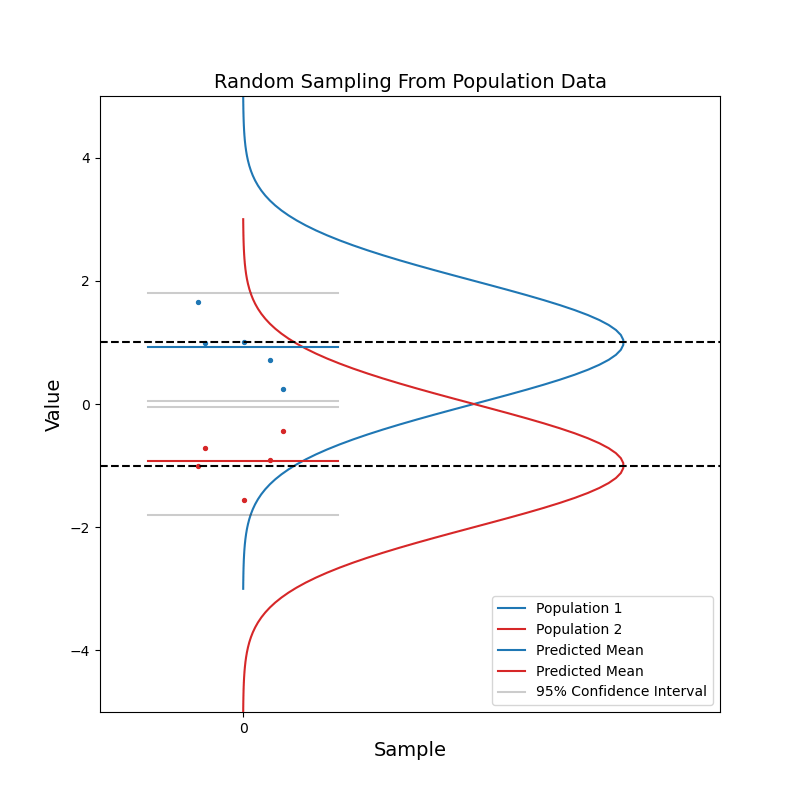
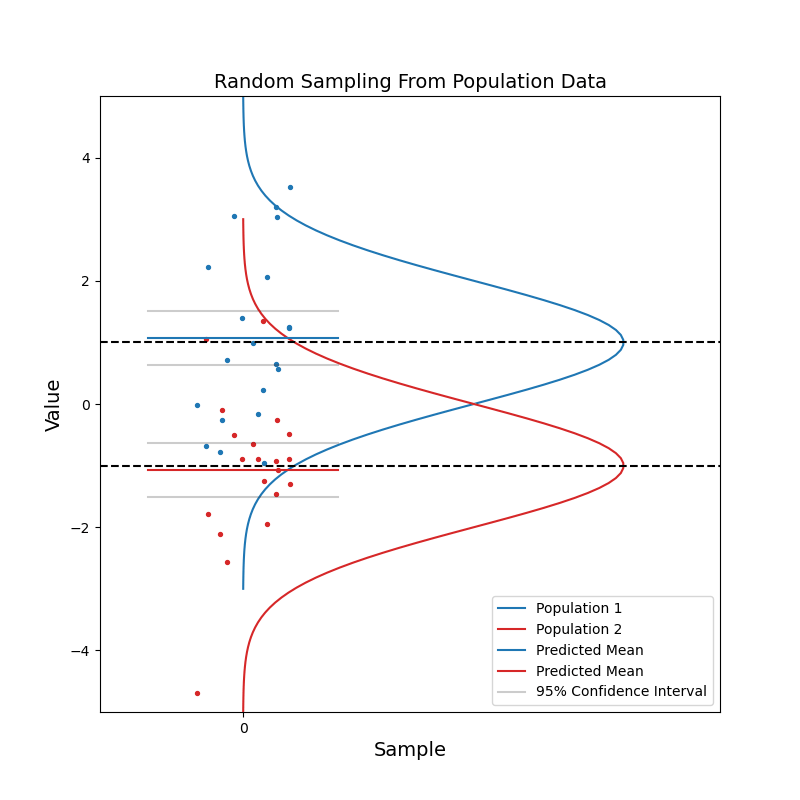
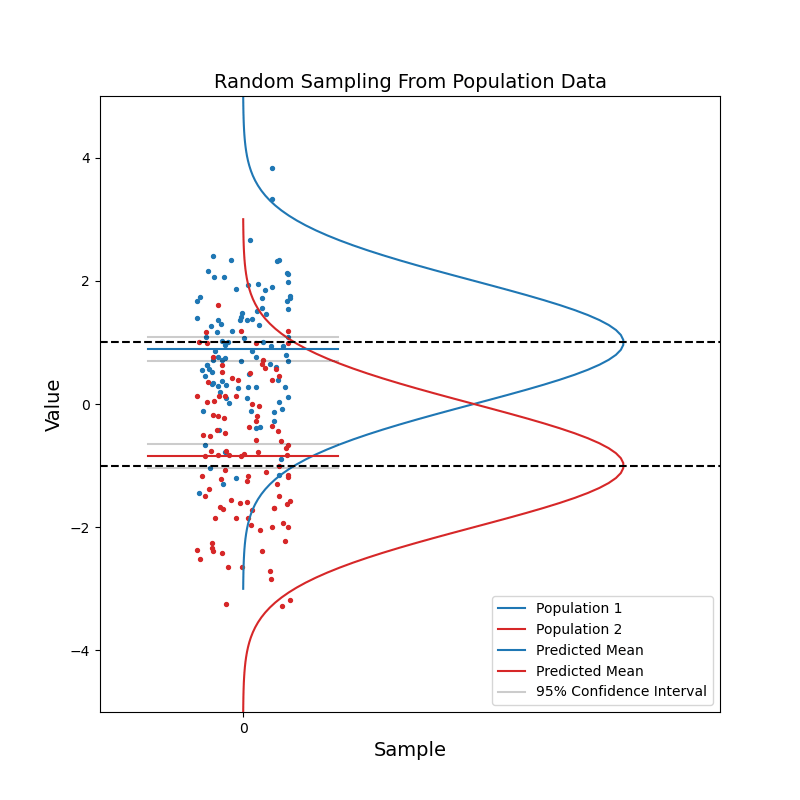
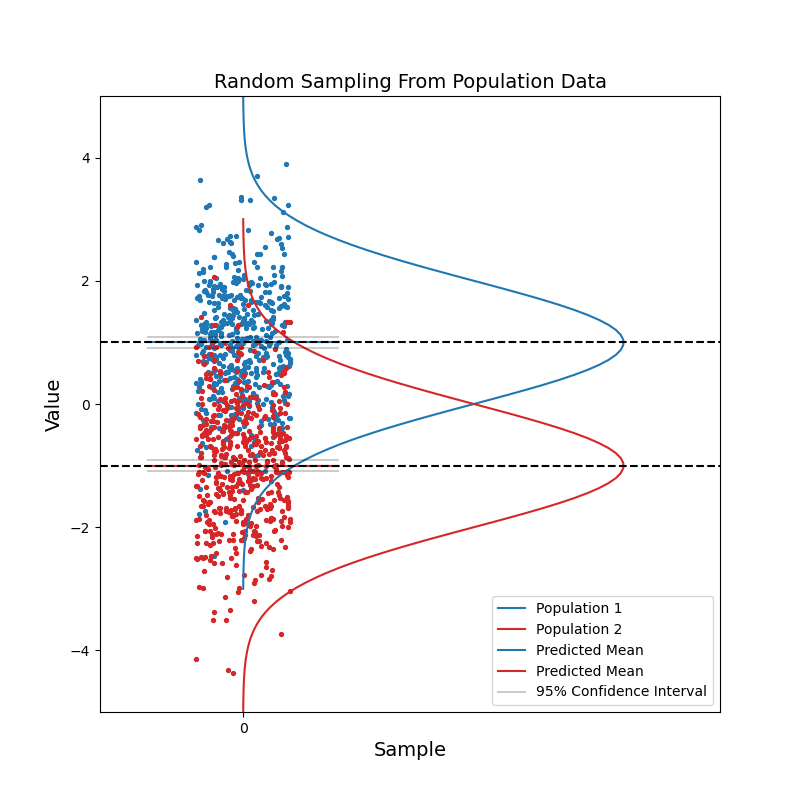
With a small sample size, we see that the two sets of confidence intervals often overlap with each other. As sample size increases, the confidence intervals get narrower, and the probability of overlapping becomes smaller.
When the two sets of 95% confidence intervals do not overlap, we can say: there is a statistically significant difference between the two population. We know the pvalue is smaller than 0.05 just by looking at the confidence intervals!